
Ever felt a bit lost when looking at your health numbers? You’re not alone. Many people find these figures confusing, even though they can tell you a lot about how your body is doing.
In this guide, we’ll walk you through your vital signs, lab tests, and trends in five easy steps. We break it down so it’s simple and straightforward, just like chatting with a friend about your well-being.
As you learn to read your report more confidently, you’ll start feeling more in control of your health. By turning those puzzling numbers into clear advice, you’ll feel empowered every day.
How to Read Your Health Metrics Report in Five Simple Steps
Your health report is like a personal roadmap that helps you feel more energized and less stressed. When you look at your numbers, you get a better idea of how to take care of yourself. It’s like having a chat with a friend who tells you, "Hey, your heart is doing great today!"
Most reports are split into three parts: vital signs, lab results, and long-term trends. Vital signs cover basic stuff like heart rate, blood pressure, and oxygen levels. Lab results dive into details such as blood sugar and cholesterol. Trends show you how these numbers change over days, weeks, or even months.
Try these five simple steps to review your report:
- First, find the key numbers in each section.
- Next, check the normal ranges for each measurement.
- Then, mark any numbers that seem too high or too low.
- After that, compare today’s readings with your past records.
- Finally, note anything unusual that might need a talk with your doctor.
By following these steps, you can clear up any confusion and feel more in control of your health.
Key Vital Sign Metrics: Quick Guide and Detailed Analysis
Knowing your vital sign numbers helps you take control of your health. When you understand these simple metrics, it's like having a quick health snapshot that shows you how well your body is doing each day.
Here are the key numbers to watch:
- Resting heart rate
- Blood pressure
- Oxygen saturation (SpO₂)
- Resting metabolic rate
- Body mass index (BMI)
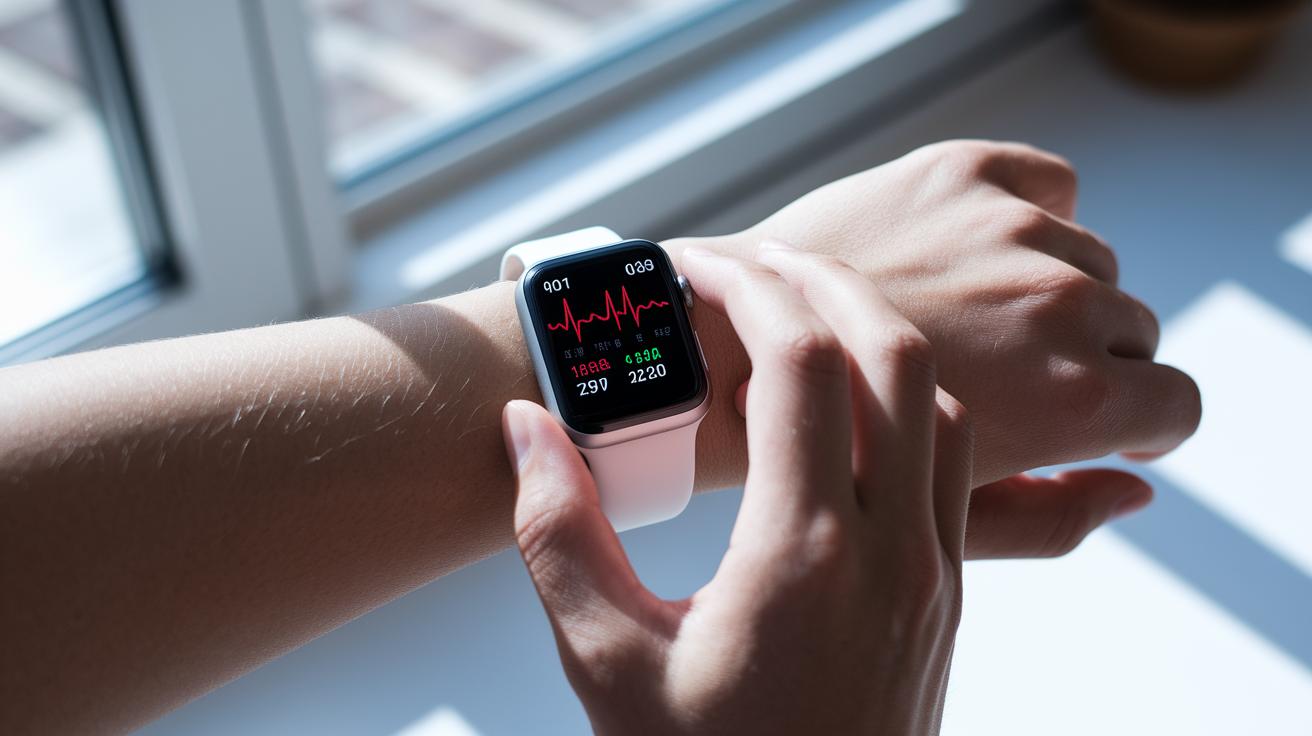
Resting Heart Rate
Most adults have a resting heart rate between 60 and 100 beats per minute, but if you work out often, it might be lower, around 40 to 60 BPM. You can check this by counting your pulse for 30 seconds and doubling the count or by using a smartwatch. These devices track your heart beat continuously so you can see improvements from exercise or signs that you might be a bit tired. For instance, if you take a brisk walk and notice your heart beats slower, it often means your heart is getting stronger.
Blood Pressure
Blood pressure is written as two numbers, like 120/80 mm Hg. The first (systolic) shows the pressure when your heart beats, and the second (diastolic) is the pressure when your heart rests between beats. If you see high numbers over time, it could be a hint to talk with a doctor about heart issues or a stroke risk. Keeping an eye on your readings lets you know if your numbers are in a healthy range or if there’s a need for a little extra care.
Oxygen Saturation (SpO₂)
SpO₂ tells you how much oxygen your blood carries and is measured with a small tool called a pulse oximeter. A normal reading is between 95 and 100 percent. If it ever drops below 95 percent, it might be wise to check in with a healthcare provider. Many fitness trackers now include this easy test, helping you feel confident that your lungs and circulation are working properly.
Keeping track of these metrics helps you build a clear picture of your overall health. If your numbers start to change or look different from usual, it might be a good idea to reach out to a doctor for advice.
Interpreting Laboratory Results: Glucose, Lipids, and Metabolic Markers
Lab tests are like little windows into your overall wellness. They help you see trends in your health so you can make smart changes or have a chat with your doctor before a small issue turns into a bigger one. Keeping an eye on tests like blood sugar, cholesterol, and other metabolic markers is an easy way to stay informed about how your body is doing.
Blood Glucose
Blood sugar tests show how your body handles sugar. When you have a test after not eating overnight, that's called a fasting level. After a meal, the test shows what we call a post-meal value. For example, if your fasting blood sugar is around 90 mg/dL, that’s generally a good sign. But if it’s above 126 mg/dL, it might be time to take a closer look. The Centers for Disease Control and Prevention provides details on healthy ranges.
Lipid Panel
The lipid panel digs deeper than just total cholesterol by checking your LDL, HDL, and triglycerides. Think of these as little carriers moving cholesterol around in your body. Instead of focusing on just one number, looking at these values together can give you a fuller picture of your heart's condition. For instance, keeping LDL below 100 mg/dL is usually a good target, while much higher levels could be a sign to watch out for imbalances.
Metabolic Markers
Other tests, like those for fasting insulin, thyroid hormones, and vitamin D, help explain how your body uses energy and stays balanced. Fasting insulin in the single digits μU/mL shows that your body uses sugar well. Your thyroid hormones keep your metabolism humming, if they're low, you might also see higher cholesterol. Vitamin D is important for a bright mood and a strong immune system; low levels can leave you feeling tired. Checking these markers regularly gives you a well-rounded look at your health.
| Metric | Normal | Borderline | High/Low |
|---|---|---|---|
| Fasting Blood Glucose | 70-99 mg/dL | 100-125 mg/dL | ≥126 mg/dL |
| LDL Cholesterol | <100 mg/dL | 100-129 mg/dL | ≥130 mg/dL |
| Fasting Insulin | <10 μU/mL | 10-20 μU/mL | >20 μU/mL |
| Vitamin D | 30-100 ng/mL | 20-29 ng/mL | <20 ng/mL |
Navigating Your Digital Health Dashboard and Trends
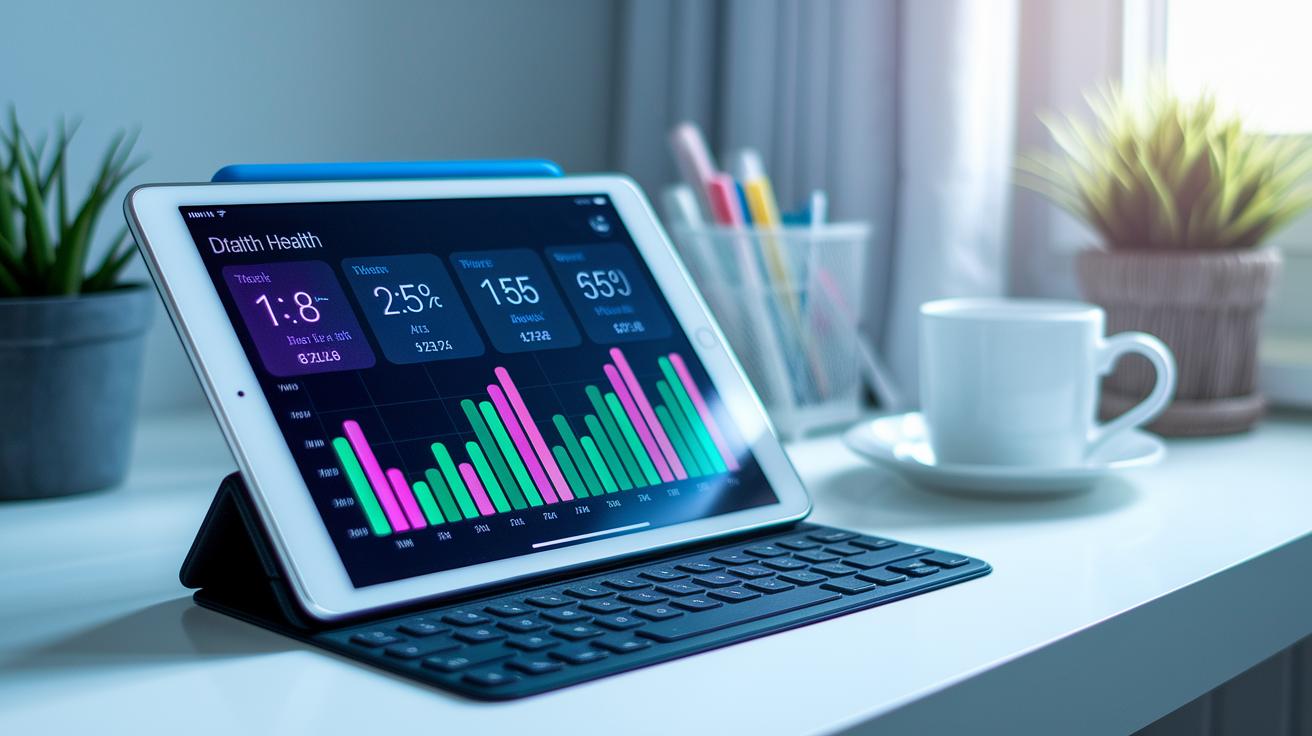
Your digital health dashboard pulls in data from your smartwatch, sleep tracker, and fitness band into one easy view. It uses smart technology to clean up the raw data, removing mistakes and shining a light on what really matters. For example, the system filters out the confusing bits so you can quickly spot when your numbers go off track.
Trend graphs show your progress over days, weeks, and months. This makes it simple to set alerts for changes in things like sleep, activity, or oxygen levels. Custom filters help you focus on the specific details you care about, like rest metrics or fitness goals. When you export your data, you can compare it over time to see patterns and make smart changes to your daily routine.
Using Your Health Metrics Report to Personalize Your Wellness Plan
Take a close look at your trends to pick one or two simple, clear goals. For example, if your resting heart rate looks a bit high, you might aim to lower it by 5 BPM over the next few weeks. Your digital report shows changes in things like hydration, sleep, or even stress. Notice how these small shifts add up to big wins for your health?
Next, fill out the easy lifestyle survey built right into your report. It asks just five quick questions about things you do every day, like when you eat, how much water you drink, or how active you are. When you see how your daily habits line up with your report, you might find that sticking to a regular bedtime could really help. These insights guide you in shaping a plan that fits your life and keeps you motivated.
Then, save or print your report to have a constructive talk with your healthcare provider. Keep a snapshot of the key parts you want to work on, like lowering your heart rate or managing stress better. With clear numbers and simple charts, your conversation will be more focused and effective. If you need a little extra guidance on presenting your health data, check out this guide for Effective Symptom Tracking for Doctor Visits (https://medsfax.com?p=1089).
Final Words
In the action, we broke down how to read your health metrics report into straightforward steps. We explained vital signs, lab results, and data from your digital dashboard to help you spot key figures and notice changes over time.
The tips shared let you compare numbers with past readings and use them to set achievable health goals. With each clear step, a healthier, more balanced routine is within reach. Stay positive and keep taking small, powerful steps toward well-being.
FAQ
How to read your health metrics report template/example?
Reading your health metrics report template means identifying key sections like vital signs, lab results, and trends, then comparing current values to standard ranges to spot changes and help you manage your well-being.
What health metrics should be tracked including examples and key metrics?
Tracking health metrics involves noting indicators such as resting heart rate, blood pressure, oxygen saturation, body mass index, and lab values, which together offer a clear snapshot of your overall health.
What are some synonyms for health metrics?
Health metrics are also known as health data, biometric indicators, or health statistics, terms that describe measurements used to evaluate your physical condition.
How can the “health” of our economy be measured?
Measuring the economy’s “health” means reviewing indicators like GDP, employment figures, and consumer spending, similar to tracking physical health metrics to determine overall performance.
What does a product health check entail?
A product health check involves reviewing performance metrics, stability, and usage data to assess how well the product is working, much like a medical checkup evaluates bodily functions.
What are the 10 health indicators?
The 10 health indicators might include resting heart rate, blood pressure, oxygen saturation, body mass index, resting metabolic rate, blood glucose, cholesterol levels, lab results trends, physical activity, and sleep quality.
How can health status be measured?
Health status can be measured by analyzing vital signs, lab results, wearable device data, and long-term trends, providing a comprehensive view of your current physical condition.