
Ever wonder how simple numbers can really change patient care? Imagine if everyday data turned into life-saving insights. Health studies show real examples; for instance, doctors can predict risks in the ICU and improve how patients move through hospitals. These little figures often lead to big wins, like quicker treatment and fewer revisits. In this post, we share inspiring stories that reveal how smart data use helps healthcare workers make better choices for every patient.
Comprehensive Health Analytics Case Studies Overview
Real-world examples show how using data can change healthcare for the better. They let us see exactly how patients benefit when numbers turn into clear actions. For instance, UCSF led a project that used live data in the ICU to flag potential problems before they got worse. These stories turn complex numbers into friendly insights that anyone can understand. For more on how data improves patient care, check out data analytics in health care.
Across many settings, these case studies cover everything from predicting risks and improving patient flow to using smart sensors for monitoring chronic conditions and planning fresh treatments based on our genes. They highlight clear, easy-to-follow examples that have led to quicker medical responses, fewer returns to the hospital, and smarter use of resources. These real-life stories make a strong case for using data at every step of patient care and hospital management.
- Predictive Analytics for ICU Risk at UCSF
- Patient Flow Simulation at Massachusetts General Hospital
- SDOH-Based Readmission Risk Stratification at Kaiser Permanente
- Medication Fraud Detection at Cleveland Clinic
- Genomic-Driven Cancer Treatment at Memorial Sloan Kettering
- Chronic Disease Monitoring via Wearable Sensors
- Real-Time Hospital Resource Dashboard Deployment
- Emergency Department Demand Forecasting
- Mental Health Crisis Prediction with Analytics
- Machine Learning for Diabetes Risk Assessment
ICU Risk Prediction: A Health Analytics Case Study at UCSF
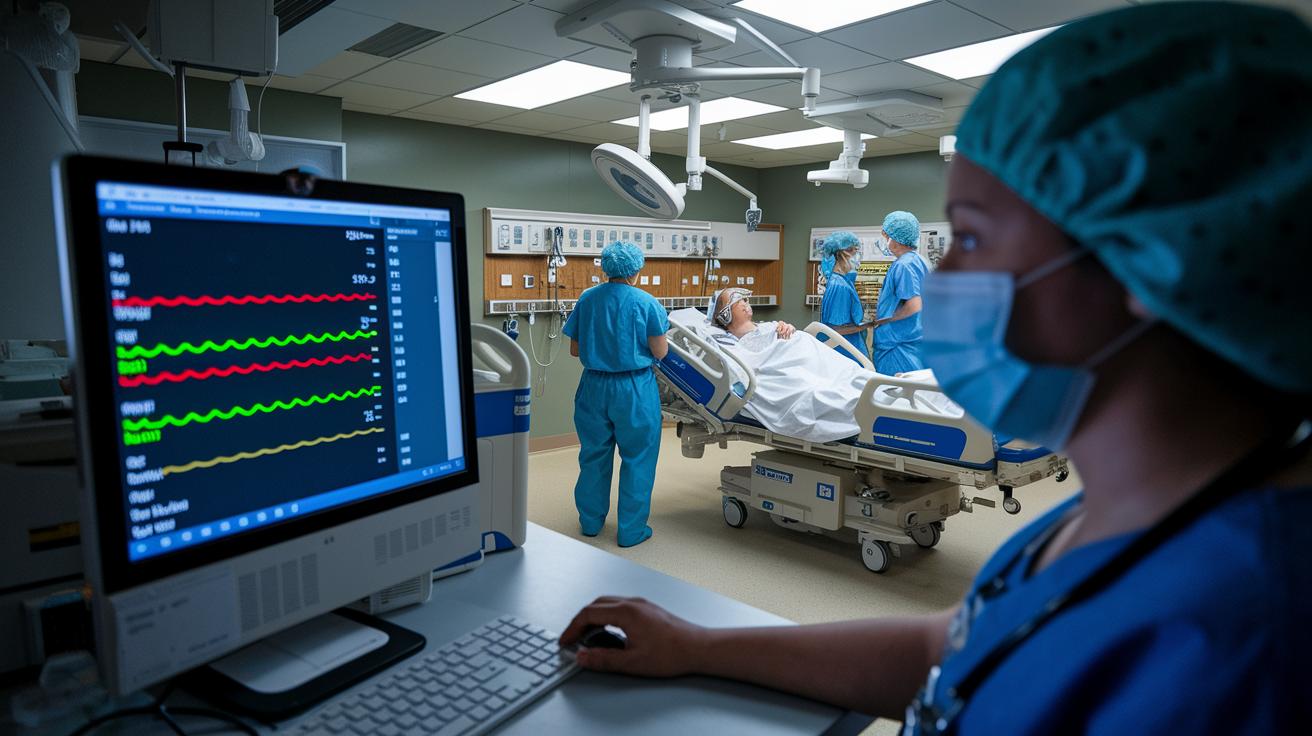
At UCSF, the ICU team started using GE Healthcare’s Mural Critical Care software to pull in live data from patient records and monitors. This system keeps an eye on vital signs and health details in real time to catch early clues of sepsis, respiratory trouble, or even a heart attack. It neatly connects patient history and current monitoring, giving doctors a steady stream of information to work with.
The team also used smart prediction methods with machine learning. They set up these models to spot small changes in a patient’s condition so that warning signs don’t go unnoticed. These models update their risk checks all the time, which means doctors get help making critical decisions every minute.
This predictive tool has really boosted patient care. It speeds up how fast critical problems are noticed and helps improve treatment responses. The benefits from using this technology include:
| Improvement | What It Means |
|---|---|
| Reduced ICU mortality | Fewer patients sadly pass away |
| Shorter average stays | Patients spend less time in the ICU |
| Faster early interventions | Doctors can act quicker when problems arise |
Patient Flow Optimization: Health Analytics Case Study at Massachusetts General Hospital
At Massachusetts General Hospital, busy periods and unpredictable arrivals often meant long wait times and uneven staffing, making it tough to stay organized during peak hours. They needed a better way to see how patients moved through the system and adjust staff and equipment to match the demand.
To tackle these issues, the hospital teamed up with an analytics firm. Using simple methods like queuing theory (a way to study lines) and simulation modeling (creating a digital model of daily operations), they gathered data on patient arrivals, staffing levels, and equipment use. For example, they simulated different staff schedules during rush periods to see where things slowed down, giving them clear insights into the delays.
This fact-based approach really paid off. Appointment wait times dropped by about 30%, making the system more efficient overall. Plus, better resource use meant staff and equipment were deployed more effectively. In the end, these smart changes helped the hospital serve patients faster while easing the operational stress.
SDOH-Based Risk Stratification: Kaiser Permanente’s Predictive Analytics Case Study
Kaiser Permanente figured out that a person’s health isn’t just about medical records. They realized everyday factors like income, education, and where you live can also shape risks. This idea of using social aspects to get a clearer picture of health helps everyone see why some folks might be at higher risk.
In partnership with IBM Watson Health, they built a system that combines clinical details with social information. The platform pulls data from electronic health records along with community and economic factors. Smart algorithms work in the background to update risk scores in real time, giving health professionals clear insights that can guide treatment and prevention.
This fresh approach has really improved patient care. The system has helped cut down hospital readmissions by spotting high-risk groups early. It also highlights patients who might need a bit more attention, which strengthens how chronic diseases are managed and makes care more responsive for everyone.
Fraud Detection Analytics: A Health Analytics Case Study at Cleveland Clinic
Mistakes in medication can hurt patient safety and lead to harmful side effects. At Cleveland Clinic, checking every medication order and record for errors was a big challenge. Even a small oversight, like an order entered too quickly, can trigger a serious reaction if it isn’t caught in time.
To tackle this, the clinic started using machine learning and natural language processing. These advanced tools scan large amounts of data, picking up unusual patterns and spotting potential errors with better accuracy. This approach lets the healthcare team quickly review any flagged issues so nothing important is missed.
Since these new methods were put in place, the clinic has seen clear improvements in patient safety. There has been a drop in adverse drug events and patients are more likely to follow their medication plans. This shows that smart, data-driven tools can help assess risks and strengthen daily clinical practices for better overall care.
Precision Care Diagnostics: Predictive Analytics in Cancer Treatment at Memorial Sloan Kettering
Memorial Sloan Kettering teamed up with Flatiron Health to mix clinical records with genomic data so that cancer treatments can be personalized. They brought together electronic health records and gene datasets into one big pool of patient info. This lets doctors see a full picture of both a patient’s medical history and their genetic details, which really helps when choosing a treatment that fits best.
The team built a strong model that uses predictive analytics (tools that help guess future trends) to work through all this varied data. They picked smart algorithms that can read both the clinical signs and the genetic signals from patients. This means the model can pick up on small differences that might be missed by old-fashioned methods. Essentially, they turned complex data into clear advice, showing how mixing different kinds of info can make treatment predictions even better.
Patients have seen real benefits from this approach. The predictive models have raised treatment success rates and cut down side effects. In simple terms, people get treatments that match their unique genetic makeup, leading to better care. It’s a great example of how personalized medicine is changing cancer treatment for the better.
Continuous Health Monitoring: Wearable Technology Case Study for Chronic Care
Smartwatches and glucose monitors are making it super simple for both patients and providers to keep an eye on vital health information every single day. In our case study, we used a mix of devices, from wearable sensors to handy mobile apps, that check things like heart rate and blood sugar levels. Patients just wear their smart bands as they go about their day, and the sensors send data straight to an app so nothing crucial gets missed. This connected system gives patients real power over their own health while helping doctors see the bigger picture in chronic care.
All the data from these devices travels safely over wireless connections to a cloud-based analytics platform. The mobile app gathers readings from various sensors in real time and organizes them into clear trends that clinicians can easily understand. Essentially, it turns raw numbers into simple, helpful insights. With this smart blend of sensor data and cloud computing, any delays are wiped away, making it easier for medical teams to review and act on health metrics.
This remote monitoring approach has led to fewer hospital visits and better control over vital health signs. Quick, proactive alerts mean that medical teams can address issues almost as soon as they pop up. Patients have enjoyed improved blood sugar management, proving that continuous health monitoring really works when it comes to managing chronic conditions.
Real-Time Resource Allocation: Emergency Department Analytics Case Study

Emergency departments can be pretty unpredictable. They sometimes get swamped with patients and face limits in resources. This often leads to long wait times during peak hours, which stresses both the care team and the patients. Crowded areas and not enough staff can make it hard to deliver the best care.
A smart, real-time dashboard was introduced to tackle this issue. The tool pulls data on things like bed occupancy, staffing, and patient flow from several hospital systems. This gives the staff an up-to-date picture of what’s happening, so they can quickly adjust their resources when needed.
With this new dashboard in place, wait times dropped by around 30%, easing the congestion. Plus, the smoother flow of data boosted staff satisfaction by cutting down on guesswork and helping manage workloads more effectively. This shows how clear, real-time insights can improve the way emergency care works.
Mental Health Crisis Prediction: A Behavioral Health Analytics Case Study
We gathered data from mobile apps, wearables, and health records to help predict mental health crises. This mix lets doctors see a clear picture of what a patient experiences every day, like tracking each heartbeat, step, and symptom to create a living snapshot of well-being.
Our team then used simple, smart models to blend these details in real time. The system watches for small changes in behavior or vital signs. When these shifts hint at a possible crisis, it sends a quick alert so help can come fast.
Clinic reports show this method really helps. Quick alerts mean doctors can step in early, and we’ve seen fewer emergencies. In short, by catching issues early, this approach keeps patients safer and more supported.
Comparing Predictive Models: Diabetes Risk Analytics Case Study
When we dive into patient records to predict health risks, we rely on smart computer programs that turn complex information into simple scores. In this study, we checked out three popular algorithms: support vector machines (a method that draws a line to separate data into groups), Random Forest (which combines many decision trees to get a vote on the result), and K-Nearest Neighbor (a technique that looks at the closest data points to decide outcomes). Each one takes detailed clinical records and simplifies them into a risk score, so healthcare teams can quickly decide on early steps.
The support vector machines model shines with a 96.6% accuracy, followed closely by Random Forest at 96.4%, while K-Nearest Neighbor comes in at 94.6%. Imagine going through thousands of patient files, even a small gap in these numbers can make a big difference when deciding the best intervention.
These side-by-side checks show us that well-tuned algorithms can really turn raw clinical data into clear, useful insights that help improve patient care.
| Algorithm | Accuracy |
|---|---|
| SVM | 96.6% |
| Random Forest | 96.4% |
| K-Nearest Neighbor | 94.6% |
Final Words
In the action, we explored real-world examples from predictive modeling to real-time resource demand, all showcasing the impact of health analytics case studies. We walked through diverse examples like ICU risk prediction, patient flow optimization, and more.
This recap offers a quick look at how applied analytics can transform everyday health management. A closer look at these case studies reveals practical ways to improve daily vitality and informed decision-making for better health outcomes. Keep moving forward with confidence!
FAQ
What do health analytics case studies examples include?
The health analytics case studies examples include real projects like ICU risk prediction and patient flow optimization that illustrate both clinical and operational benefits.
What do health analytics case studies and healthcare case study PDFs provide?
The health analytics case studies and healthcare case study PDFs provide detailed insights into real-world projects, breaking down complex analytics applications into clear, reader-friendly formats.
How are health analytics and business analytics case studies with solutions PDFs structured?
The health analytics and business analytics case studies with solutions PDFs are structured to offer practical, step-by-step guidance on solving analytics problems through real-life scenarios and applied problem-solving techniques.
Are there health analytics case studies designed for students?
The health analytics case studies for students are tailored to simplify complex data concepts, making them accessible and beneficial for academic learning and practical application.