
Have you ever thought that a simple number might really improve your health? Just like checking your car’s dashboard to see how the engine is doing, blood pressure and blood sugar readings give you an easy snapshot of your body’s wellbeing.
Today, we’re talking about two key health numbers that can help you manage chronic conditions and truly thrive. These numbers help both you and your doctor notice small changes early on, making it easier to adjust your care and keep your health in check.
Core Health Metrics in Chronic Disease Management
Tracking simple health numbers is super important when you're managing a long-term illness. It’s a bit like glancing at your car’s dashboard, you know something’s off if your fuel or speed seems unusual. Doctors rely on measures like blood pressure and blood sugar levels to see if treatments are hitting the mark. By checking these numbers often, small changes can be seen early, which helps tweak your care plan before big issues arise.
Key numbers include blood pressure, blood sugar (measured by HbA1c, which shows average blood sugar over a few months), cholesterol levels like LDL and HDL, as well as weight or BMI, and even activity counts. Each of these tells a part of your health story. For instance, balanced blood pressure can lower your risk of strokes, and steady blood sugar helps manage diabetes better. Imagine noticing your HbA1c drop from 8% to 7%, that little win could make you feel more in control of your health.
Doctors and patients use these numbers to set clear, shared goals. They might aim for a blood pressure below 130/80 mmHg or keep HbA1c under 7%, and then adjust diet, exercise, or medications as needed. Using these solid benchmarks helps everyone stay on top of managing the condition and makes your care feel both personal and effective.
Clinical Thresholds and Performance Standards for Chronic Disease Metrics
The numbers below come from many trusted clinical studies and health experts. They set these targets by comparing patients who kept key measures, like blood pressure under 130/80 mmHg and HbA1c under 7%, with those who didn’t. Studies on type 2 diabetes and high blood pressure show that hitting these targets can lower the risk of heart problems. National guidelines for checking cholesterol and blood sugar back up these real-life numbers.
Following these thresholds helps care teams know when a change might be needed to keep risks low. Doctors use them as a handy guide to track progress and make choices that reduce serious complications. It’s like having a clear picture of how steady or unstable a heart rate can be.
| Metric | Clinical Threshold |
|---|---|
| Blood Pressure | <130/80 mmHg |
| HbA1c | <7% |
| LDL Cholesterol | <100 mg/dL |
| BMI | 18.5–24.9 |
Digital Health Tracking Techniques and Condition Monitoring for Chronic Disease Metrics
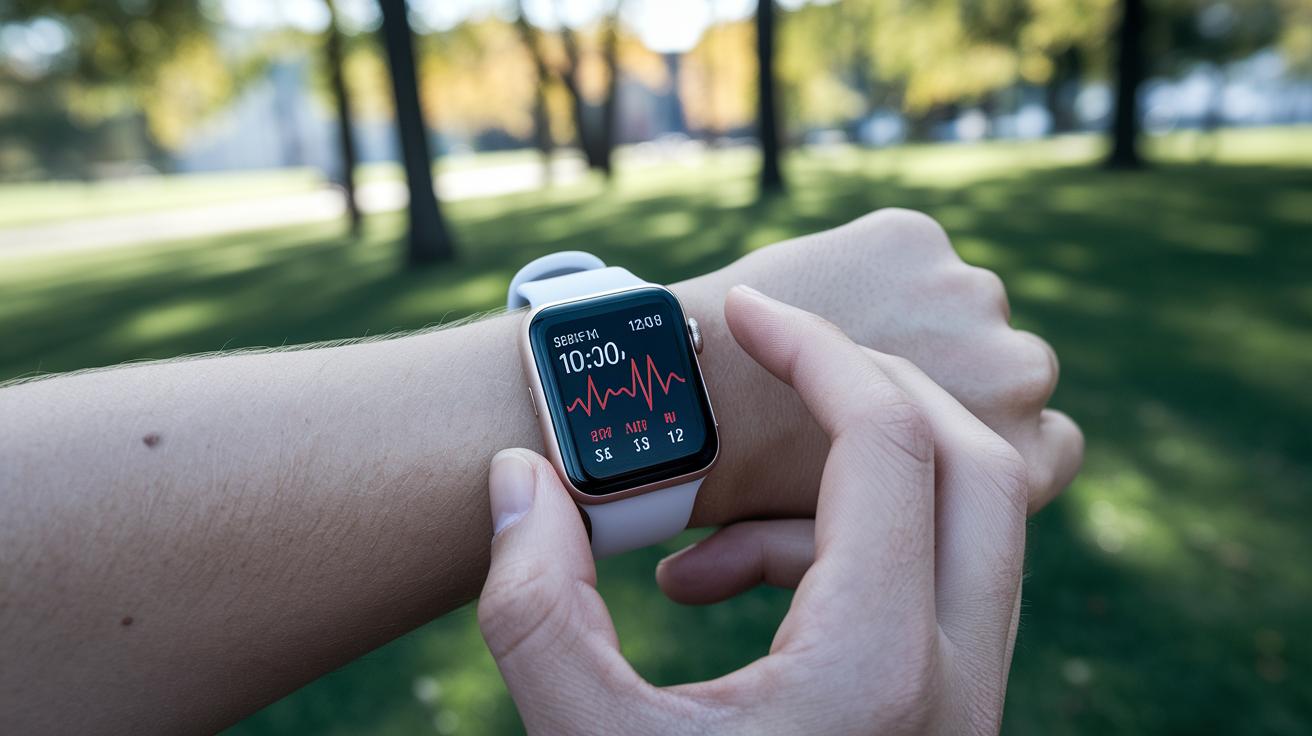
Remote monitoring tools, like telemonitoring sensors and wearable gadgets, collect your blood pressure, blood sugar, and daily activity data as it happens. These devices send you real-time updates that show how your body is doing throughout the day. For instance, a wearable sensor might share your current heart rate and step count, letting both you and your health team stay informed.
Mobile apps and digital symptom journals help you manage your day-to-day health too. They let you record how you feel, whether that's a burst of energy, a dip in mood, or a change in physical symptoms. And, if something is off, like a sudden spike in blood sugar, you might get an automatic alert, prompting you to adjust your meal plan or even call your care manager. It’s a bit like getting a friendly reminder when you need to check in on yourself.
All this gathered data flows smoothly into electronic health records through automated feeds. That means your doctor can easily see a full picture of your health trends over time. With these insights, clinicians can adjust treatments to help keep your condition well-managed over the long run.
Data Analysis and Trend Evaluation of Chronic Disease Health Metrics

Looking at trends over time is super important for knowing how patients are doing and tweaking treatments. We track shifts in health numbers to spot even tiny changes that might show how well a treatment is working. Comparing these numbers with national standards gives doctors a clear picture, like checking a patient’s blood pressure over several months against set guidelines. This kind of check helps healthcare teams catch issues early and adjust care plans before problems grow.
Risk adjustment and progression rate calculations add even more insight. These methods make sure we compare each patient's data fairly by considering differences like age, other health conditions, or lifestyle habits. Meanwhile, progression rate calculations let us see how fast a patient’s condition is changing. For instance, studies suggest that keeping blood pressure steady can cut the risk of heart problems by about 20–25% in patients with high blood pressure and diabetes. Using these techniques together lets doctors understand the impact of different factors on a patient’s health.
The insights from these analyses help shape ongoing treatment plans. Regular data reviews show overall progress and highlight times when new actions might be needed. If the numbers start to trend in a worsening direction, care teams can change medications or suggest lifestyle tweaks. These thoughtful, step-by-step adjustments ensure that each treatment plan stays in tune with the patient’s ever-changing needs.
Risk Stratification Models and Personalized Patient Benchmarks in Chronic Disease Metrics
Healthcare teams use risk models to group patients based on how severe their conditions are. These models check things like test numbers and other health issues to sort patients. For example, someone might have well-controlled blood sugar levels but face other challenges that need more attention. This way, doctors can focus their care on patients who need it the most.
Then, care teams work with patients to set personal health goals that match their risk levels. Chronic care managers team up with patients to create simple, clear goals, like lowering blood pressure or tweaking medication based on past progress. These personal benchmarks help everyone see how treatment is going and remind patients of their important role in managing their own health.
Tools like the Framingham Risk Score back up this process by showing how well a treatment is working. Health professionals use these tools to adjust plans on the fly. By honing in on each patient’s unique situation, care teams have found that this approach can reduce the risk of further issues. All of this careful work makes patients feel more secure and confident about the way their chronic conditions are managed.
Sustained Care Evaluations and Quality Improvement Using Health Metrics in Chronic Disease Management

Care teams check health numbers often so they can spot changes early and update treatment plans quickly. Each month, care managers spend about 20 minutes with each patient to review preventive steps, make sure medicines are being taken correctly, and discuss everyday factors that affect health. It’s a bit like a pilot checking the instruments before takeoff to make sure everything is in order. This routine helps doctors and nurses stay ahead of problems instead of waiting for them to pop up.
Also, using patient feedback and data is a big part of making care better over time. Providers compare new numbers with past trends and even national guidelines to see exactly where improvements are needed. For example, if a patient’s blood pressure isn’t at the right level, the care team can adjust the treatment plan right away. These regular check-ins not only guide quick fixes but also help create long-term strategies to manage chronic disease more effectively.
Final Words
In the action, the article explored how measurable indicators shape our understanding of chronic illnesses. It walked through key measures like blood pressure, glucose, and BMI while highlighting the role of digital sensors, data tracking, and trend analysis. The discussion also covered performance standards and personalized care that drive proactive health routines and patient success. By closely monitoring these health metrics for chronic disease management, both patients and care providers can make smarter, energizing lifestyle choices. Here's to using data for a healthier, happier future.
FAQ
What do the CDC and U.S. Chronic Disease Indicators datasets provide?
The CDC and U.S. Chronic Disease Indicators provide government-curated data on conditions like diabetes and hypertension, offering valuable metrics that help monitor health trends across communities.
How do chronic disease datasets and charts, including those on Kaggle, help health monitoring?
Chronic disease datasets and charts, such as those found on Kaggle, compile data on conditions and risk factors, allowing researchers and providers to track trends and assess community health effectively.
What do chronic disease assessment tools and community resources support in disease management?
Chronic disease assessment tools and community resources enable patients and caregivers to monitor symptoms, schedule preventive screenings, and connect with programs that support better self-management of their conditions.
What do the 5 C’s and 4 C’s in chronic disease management represent?
The 5 C’s and 4 C’s highlight key elements of managing chronic conditions, including care coordination, communication, and compliance, with specific frameworks varying by organization to guide effective management.
What is the chronic disease indicators tool used for?
The chronic disease indicators tool aggregates health data from various sources to display key metrics, helping public health officials and clinicians monitor and address chronic conditions within populations.
What chronic illness is often considered the hardest to live with?
The hardest chronic illness to live with can vary, but many find that conditions like fibromyalgia and chronic fatigue syndrome are particularly challenging due to persistent pain and fatigue impacting daily activities.

