Ever wonder what your health numbers really mean? Your heart rate, blood sugar, and sleep patterns can be like a diary for your body, giving you clues about how you're feeling each day. In this article, we're going to walk through some easy ways to read these numbers so you can notice changes early on. By paying attention to these everyday signals, you can make little tweaks that help you feel better. Let's turn those puzzling figures into simple steps for a healthier, happier you.
Interpreting Health Metrics: Essential Guide
Understanding health metrics is a bit like checking in on your overall well-being each day. These numbers help you keep track of important things like your heart rate, blood pressure, oxygen levels, body temperature, sleep habits, blood sugar, and BMI. When you monitor these readings consistently, you can easily spot changes that might mean you need a little extra care. For example, if you notice your resting heart rate slowly creeping up, it could be a sign that you're feeling stressed or overworked.
Doctors and health experts look at these numbers by comparing them to standard healthy ranges. Take sleep, for instance. Tracking your sleep over time might show that you’re getting less rest during tough weeks, which could be your body’s way of saying it needs more downtime to recharge. This simple observation turns raw data into a clear message: sometimes small changes in our daily routine can really boost our energy.
Many people turn to wearables like Apple Watch, Fitbit, and Garmin to keep an eye on their health. These devices do a great job of tracking your resting heart rate and counting your steps. But during really intense workouts, they might not always get the calorie count right. That’s why traditional medical tools are still important for getting the most accurate numbers. By using both digital gadgets and regular checkups, you build a fuller picture of your health, making it easier to take control and make decisions that fit your personal wellness journey.
Vital Sign Deciphering in Health Metrics

Knowing your vital signs is like getting a mini checkup every day without having to visit a doctor. When you keep track of numbers like blood pressure, heart rate, oxygen saturation, and body temperature, you get helpful hints about how your body is doing.
For instance, consider blood pressure, it shows two numbers. The first number, called systolic pressure, measures the force when your heart beats and should be between 90 and 120 mmHg. The second, diastolic pressure, measures the force when your heart rests and should fall between 60 and 80 mmHg. Your resting heart rate, the number of heartbeats per minute, ideally sits between 60 and 100 bpm. Oxygen saturation, or SpO₂, should usually be above 95%, and your core body temperature is typically between 97°F and 99°F. Even small changes in these numbers can be early signs that something isn’t quite right.
Below is an HTML table to quickly show the healthy ranges:
| Vital Sign | Definition | Healthy Range |
|---|---|---|
| Blood Pressure | Systolic/Diastolic measurement in mmHg | 90–120 / 60–80 mmHg |
| Heart Rate | Number of heartbeats per minute | 60–100 bpm |
| SpO₂ | Oxygen saturation in the blood | Above 95% |
| Temperature | Core body temperature | 97°F–99°F |
By paying attention to these numbers each day, you can catch small changes early and step in before minor issues turn into bigger concerns.
Laboratory Biomarker Interpretation in Health Metrics
Lab tests give you a quick look at what’s happening inside your body. For example, your total cholesterol should be below 200 mg/dL. LDL, often called the “bad” cholesterol, should stay under 100 mg/dL, while HDL, your “good” cholesterol, works best between 40 and 60 mg/dL. Triglycerides, another important measure, should be less than 150 mg/dL. So, if you find your LDL above 100 mg/dL, it might be a good time to review your diet and activity levels.
Fasting glucose levels are another key sign. A normal fasting glucose is between 70 and 99 mg/dL. When the number drops between 100 and 125 mg/dL, it hints at a prediabetic range, suggesting that small lifestyle changes might help. Imagine checking your report and seeing 110 mg/dL, it’s like a gentle reminder to consider a few tweaks in your eating habits.
Body Mass Index (BMI) is a useful tool that shows if your weight is in a healthy range. A BMI below 18.5 suggests you might be underweight, 18.5 to 24.9 is normal, 25 to 29.9 means you’re overweight, and 30 or more points to obesity. These figures help you understand if your weight could be putting your health at risk.
If your numbers fall outside these healthy ranges, it might be a sign to change your lifestyle or chat with a healthcare professional. Tools like data analytics in health care can help track these values over time, spotting tiny changes before they turn into bigger issues.
Wearable Data & Lifestyle Metrics in Health Metrics
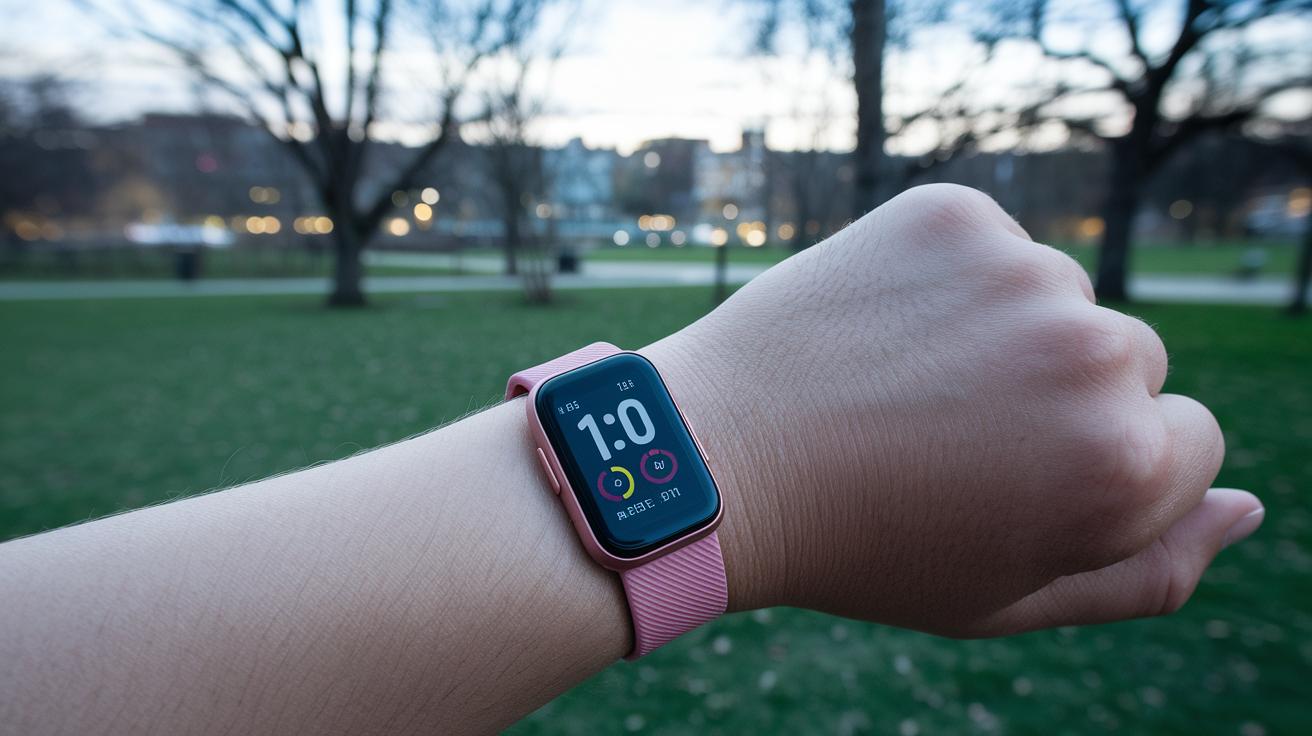
Wearable gadgets, like smart rings and fitness trackers, keep an eye on your everyday steps, active minutes, sleep stages, and even heart rate variability (that is, the natural ups and downs between your heartbeats). For instance, if your smartwatch records 8,500 steps, it tells you not only how many steps you took but also how many minutes you stayed active.
These devices do a pretty good job tracking your resting heart rate and counting your steps. But sometimes, they might not be totally accurate about calories burned or the exact stages of your sleep, especially when you’re doing intense workouts. Fun fact: a recent study discovered that even popular fitness trackers can sometimes overestimate calorie burn during heavy exercise.
To really understand how you’re doing, it helps to look at several numbers together. Your daily steps tell you about your overall movement, moderate-to-vigorous activity minutes show the intensity of your workout, and sleep duration lets you know if you’re getting enough rest.
While smartwatches like the Apple Watch, Fitbit, and Garmin are great for keeping tabs on your health, they aren’t perfect. If something seems off, it’s wise to compare these readings with a traditional checkup. You might also want to explore additional tools or check out resources on "wearable tech for health" and "healthcare analytics" for a deeper dive into how accurate these devices really are.
Using these insights can give you a fuller, more dynamic view of your daily activity and overall health, helping you make smart choices every day.
Visualizing Health Metrics: Trends & Patterns
Line charts are a great way to watch how your health changes week by week. They can show details like your blood pressure or how long you sleep. When the line goes up or down, it gives you an instant clue about what might be happening with your body. For instance, if you notice your blood pressure slowly rising, it might be time to adjust your habits or even check in with your doctor.
Rolling-average curves help smooth out the daily ups and downs that can make the numbers look messy. These curves change a jumble of data into a clear line that shows the big picture of your health trends. And then there are scatterplots. Picture one where your blood sugar levels are compared with your daily exercise. If the pattern starts looking unusual, it could be a sign to keep an eye on things.
Using these visualization tools gives you the power to spot little shifts before they become bigger concerns. A handy tip: always compare your latest readings to your usual numbers. For example, even a small drop in your weekly sleep hours might signal the need for more rest. By turning your daily figures into simple, clear graphs, you can take action to support a healthier lifestyle.
From Metrics to Action: Personalized Health Audit

When you keep an eye on your vital signs, lab tests, and data from wearables, you get a clear snapshot of your well-being. Start by looking at your personal baseline. For example, if you notice your resting heart rate is around 75 beats per minute, you might set a goal to lower it by 5 beats over the next three months. Simple tests like checking your blood pressure and cholesterol each year, along with understanding your glucose levels or BMI, can help catch any issues before they become bigger problems.
Once you know your numbers, it’s time to set up SMART goals, goals that are Specific, Measurable, Achievable, Relevant, and Time-bound. Maybe you'll decide to try out a new diet plan, add more daily steps, or take a few extra minutes for quiet relaxation to lower stress. Regular check-ups, like monthly blood pressure self-assessments and yearly cholesterol screenings, keep you on track by spotting small changes early.
Mixing your tracking with clear actions can really make a difference. When you review your progress in sleep, exercise, or eating habits, you can see if your efforts are working. With simple adjustments and regular reviews, your health milestones become clear, practical steps that lead to a better daily routine. Over time, watching these numbers change builds your confidence that little, smart tweaks can make a big impact.
Final Words
In the action of exploring our guide, this post broke down how to read lab values, track vital signs, and consider wearable data for everyday wellness. It showed how spotting trends leads to practical steps and a clearer picture of your health.
We walked through ways to make interpreting health metrics both simple and practical. Tuning into these insights can help brighten your daily routine and steer you toward a healthier, more confident life.
FAQ
What are health metrics and can you give examples?
The term health metrics refers to quantitative measures that assess personal well-being. For instance, they include heart rate, blood pressure, oxygen saturation, sleep patterns, glucose levels, and BMI.
What is a synonym for health metrics?
The phrase health metrics may also be called health indicators by reflecting measurable factors of personal well-being. They serve as a snapshot of overall health status and trends.
What are occupational health metrics?
Occupational health metrics measure workplace-related health factors, such as exposure to hazards, employee well-being surveys, and injury rates to support enhancements in safety and overall employee wellness.
What are the key health metrics?
The key health metrics include vital signs like blood pressure and resting heart rate, lab results like cholesterol and glucose, along with lifestyle data captured by wearable devices that indicate overall health levels.
What are the four major categories of health determinants?
The four major categories of health determinants are environmental factors, behavioral choices, genetic predispositions, and social conditions. Together, they shape overall well-being and risk profiles.
What are the 10 health indicators?
The ten health indicators typically include measures such as life expectancy, disease prevalence, access to care, preventive service use, stress levels, and physical activity, giving a well-rounded view of community health.